VertiStratInsights Main website ↗

The Grain Value Loop — Integrated Rice Biorefinery Pitch

Friday, July 31, 2026
The Grain Value Loop — Integrated Rice Biorefinery Pitch

An integrated rice biorefinery model that turns the byproducts India's government already procures — and currently gives away — into edible oil, food-grade derivatives, energy, and exports. Feedstock the state owns; demand the state can contract.

Investment & policy concept · India · 2026

The Grain Value Loop

Skip to article content
Text Size
Import substitution
₹21,000 cr
per year, across crops
Bran given away today
₹7,650 cr
in free CMR byproduct
Capital subsidy
35–50%
PMFME · PMKSY · PLISFPI
FCI-warehouse-MSPvsMSV · figures verified against DFPD, DGCI&S, MoFPI, real project DPRs
The paradox
Updated 2 November 2026. The questions left open in the 13 October note below are now answered by the oil companies’ 2026-27 ethanol tender, opened on 16 October: the 72 lakh tonnes of FCI rice runs to 30 June 2027 (so it is the 2026-27 allocation), the requirement that 40% of grain offers come from FCI rice has been dropped and replaced by a cap of 108 crore litres of FCI-rice ethanol a quarter, and the maize incentive mentioned below has been cut from ₹5.79 to ₹2.79 a litre, so maize ethanol now fetches ₹68.86 a litre instead of ₹71.86. Details: India’s 2026-27 Ethanol Tender Drops Cane Juice, Cuts Maize by Rs 3 a Litre and Flips From Sugar-First to Cheapest-First. The original text below is unchanged.
Updated 27 October 2026. Feed’s share of India’s maize crop was given as 60–70%. The upper end rests on a single source (DownToEarth); the slide now says “about 60%”. India becoming a net maize importer in 2024 is confirmed.
Updated 13 October 2026. The 40% FCI-rice clause and its 30 June 2026 sunset, described below as “the live instrument”, applied to ethanol supply year 2025-26, which ends on 31 October 2026. Press reports say about 7.2 million tonnes of FCI rice has been allocated for ethanol in 2026-27 (up from 5.5 million), with the issue price rising from ₹2,320 to ₹2,390 a quintal from 1 November 2026; one S&P Global item attributes the 7.2 million to 2025-26 instead, so the year is unclear. Whether the 40% condition carries into the new OMC tender has not been confirmed. Sources: Bioenergy Times, NewsBytes. The original text below is unchanged.

India imports what it grows — and gifts the feedstock

The government procures ~520 LMT of rice and ~300 LMT of wheat a year, then hands the milling byproducts to private millers for free and imports the finished derivative.

What the state does today

  • Procures paddy at MSP, hands it to CMR millers
  • Millers keep ~180 LMT husk + ~65 LMT bran — the ₹7,650 cr byproduct giveaway (this figure matches only the ~40 LMT CMR-bran base, not the full husk+bran tonnage)
  • Sells surplus grain raw (OMSS) at ~2–4% trader margin, often at a loss

What the state imports

  • 57% of edible oil (~₹1,68,000 cr/yr) — while #1 in rice-bran oil
  • 67 LMT of pulses, vital wheat gluten, specialty starch, Vitamin-E, silica
  • The derivative — while holding the raw material
World's #1 rice-bran-oil producer, yet imports more than half its cooking oil. The same pattern repeats for gluten, starch, protein, and nutraceuticals across every crop the state procures.
Sources: DFPD Annual Report 2024-25 · DGCI&S FY26 · NITI Aayog edible-oil
The insight

Value density rises ~1,000× from grain to derivative

The margin is in the cascade, not the commodity — the sugarcane model (sugar + ethanol + power + CBG) ported to grain.

Paddy
₹24/kg (MSP)
→
Milled rice + bran + husk
the split the state gives away
→
Rice-bran oil
₹105/kg
→
Oryzanol / Vit-E
₹1,200–17,700/kg
Commodity floor
₹7–40/kg
flour, feed, husk, power — where the state operates now
Industrial mid
₹40–110/kg
RBO, silica, starch, gluten, dal, besan
Molecular tail
₹350–17,700/kg
wax, protein, oryzanol, tocotrienols
The state captures the bottom tier and gifts the top three. Source: byproduct product-tree (39 products)
The project

An integrated rice biorefinery — one complex, many streams

A cooperative/PPP-hosted complex, sited in an operational Mega Food Park, that takes government CMR paddy and runs the full cascade instead of milling and selling raw:

Rice millBran stabilisation RBO solvent extractionRBO refinery Oryzanol / wax recoveryHusk-fired power Husk-ash → silicaBroken rice → poha/murmura Fortified rice kernelsDORB → feed

Why integrated

  • Husk powers the process (already standard mill practice) — energy self-sufficient
  • DORB feed credit makes the oil cheap (₹60 vs ₹105/kg)
  • One feedstock stream → 8+ revenue lines
  • The distillery/mill is the natural aggregation host
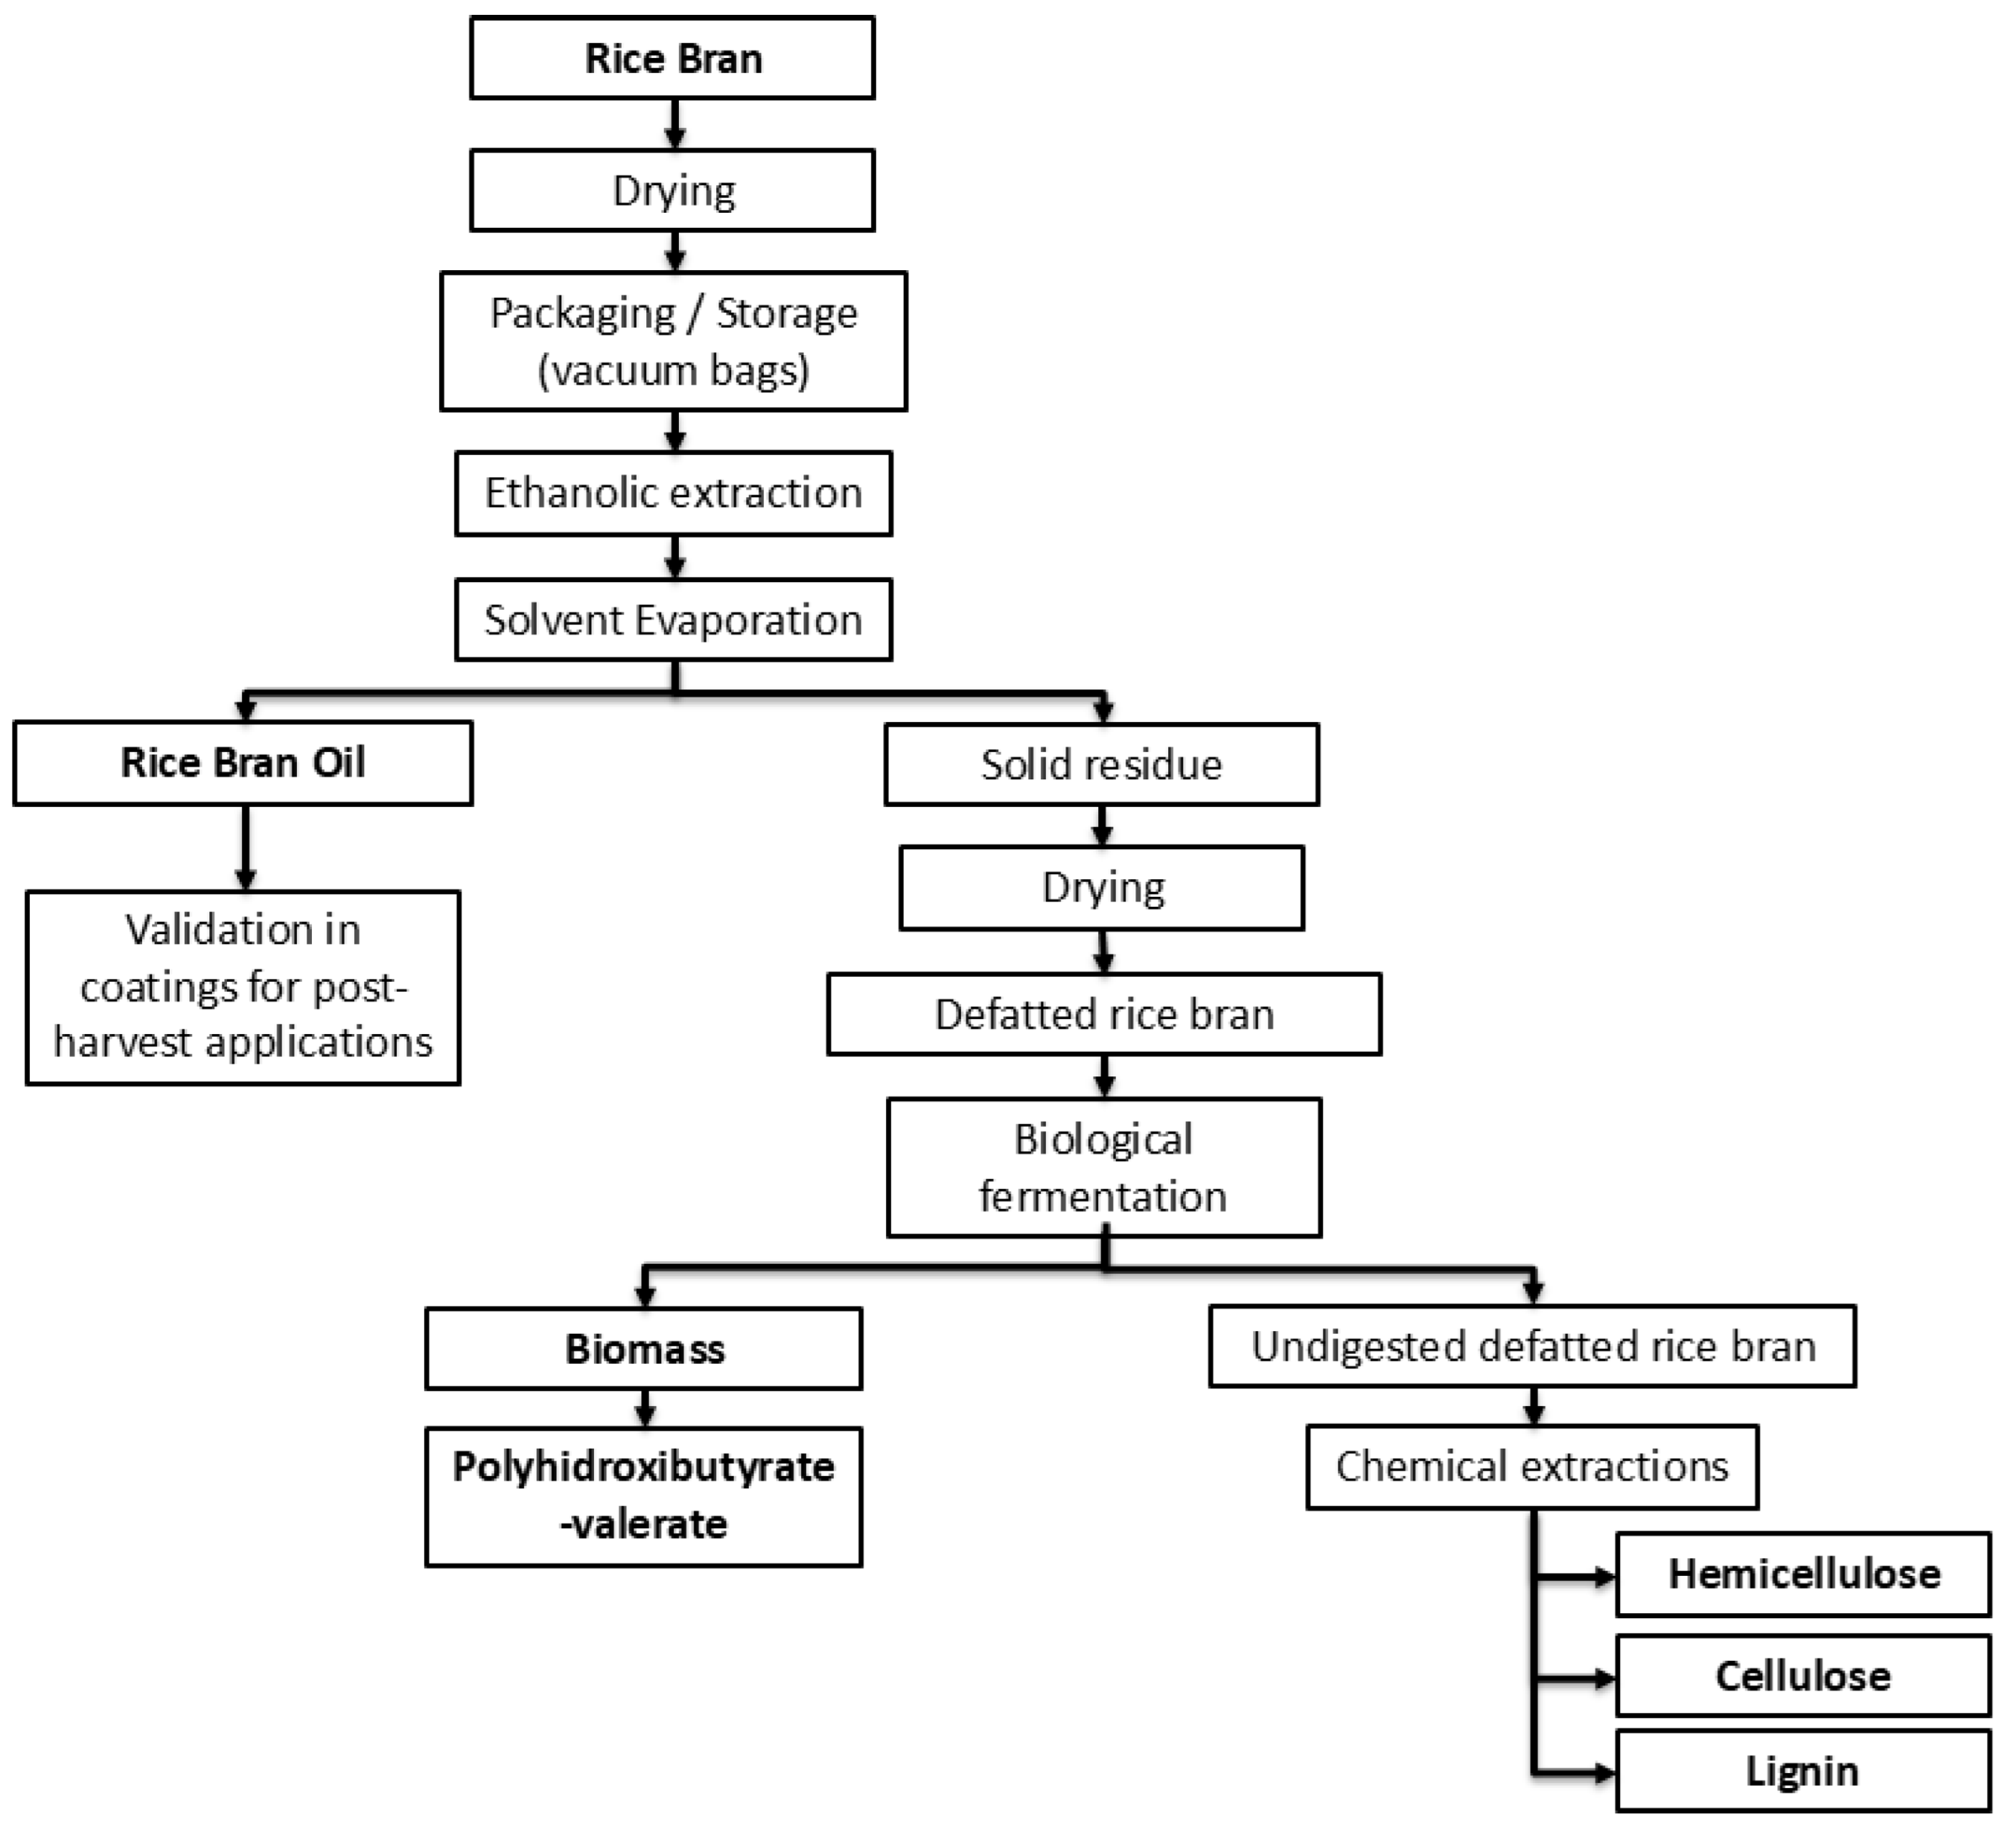
Branching flow diagram: rice bran is dried, packaged and solvent-extracted into rice bran oil and a solid residue; the residue is dried, defatted and fermented into biomass and polyhydroxybutyrate-valerate on one branch, and undigested defatted bran on the other branch is chemically extracted into hemicellulose, cellulose and lignin
The same “one feedstock, many outputs” logic this pitch argues for — shown here for the bran stream specifically (oil, biopolymer, cellulose/hemicellulose/lignin), not the husk or broken-rice streams this article also covers. From Navajas-Preciado, Martillanes, Galván, Rocha-Pimienta, Ramírez-Bernabé & Delgado-Adámez, “Rice Bran Biorefinery: A Zero-Waste Approach to Bioactive Oil and Biopolymer Production,” Sustainability 17(22):10219 (2025), Figure 1, DOI 10.3390/su172210219. Licensed CC BY 4.0.
Edible oil first (import substitution at ₹105/kg), fuel only from the non-edible residual — India must diverge from the US "distillers-oil-to-biodiesel" model.
Grounded in NCDC cooperative rice-mill DPR + SEA (30 MT existing crush capacity). Bran-stream diagram — Navajas-Preciado et al. (2025), Sustainability 17(22):10219, CC BY 4.0; illustrates the bran branch only, not the husk or broken-rice streams in this pitch.
Raw material · prices & sources

Feedstock the state already owns

InputIndicative price, ₹/qtlSource / basis
Paddy (common)2,369MSP KMS 2025-26 · govt CMR procurement (~832 LMT)
Rice bran2,000 (20/kg)NCDC DPR · to oil extractors; 16–22% oil
Rice husk200NCDC DPR · fuel-grade; ~20% of paddy
Broken rice1,500NCDC DPR · poha/starch/ethanol feedstock
De-oiled bran (DORB)1,500 (credit)feed byproduct — the credit that makes RBO viable

Aggregation model

PACS / FPO / cooperative societies — already the paddy-procurement centres — aggregate paddy + bran. The feedstock chain exists; it is currently dispersed to 100,000+ private mills.

Scale available to government

~832 LMT CMR paddy → ~40 LMT government-touchable bran (41% of national) → ~6.4 LMT RBO at full capture.

Prices: NCDC "Establishment of Rice Mill" DPR (Chhattisgarh) · DFPD MSP · vintage noted. Caveat: spot prices move — a Kurnool AP price surge (Deccan Chronicle, Aug 2026) reported husk doubling to ₹6,000/MT and bran rising to ₹40/kg, both well above this DPR baseline; treat the table as a floor, not a current quote.
Unit economics · from real DPRs

Margin and IRR — ranked, government-DPR-backed

ProductNet margin, %IRR, %DPR source
Poha / murmura10–15<3y paybackNIFTEM-T PMFME ✓
RBO solvent extraction8–15—IMARC/EIRI
Rice mill (anchor)8.5–1519NCDC ✓
Maize wet-milling (starch)12–2022–28industry
Dal mill~5.325–31RACP + NIFTEM ✓
Roller flour mill3–5.520–29RACP ✓
Margin ≠ return. The staples show thin 3–5% margins but 19–31% IRR — low capex, fast turnover. The "process, don't sell raw" case rests on return-on-capital, not margin-on-sales.
Sources: NCDC · Rajasthan RACP (Grant Thornton) · NIFTEM-Thanjavur PMFME · IMARC — verified/reported labelled
Schemes · the funding stack

35–50% of capital comes from MoFPI

PMFME

35%
credit-linked capital subsidy, max ₹10 L/unit · micro units (RBO, dal, poha, besan)

PMKSY

35–50%
grants for clusters, cold chain, agro-processing (50% NE/difficult) · the integrated complex

PLISFPI

6-yr
incentive on incremental sales + branding-abroad · large branded (RBO brand, exports)

Mega Food Park infrastructure

23 operational parks (of 41), ~₹120 cr each with ~₹50 cr PMKSY grant — ready common facilities (power, cold chain, warehousing, effluent) to plug into, not build.

The subsidy is a margin multiplier

Anchor DPR: ₹80 L cost → ₹16 L subsidy + ₹52 L loan + ₹12 L own. The 19% project IRR becomes a much higher return on the ₹12 L actually invested. Capital-heavy units (RBO, silica, wet-milling) gain the most from a 35–50% grant.

Sources: pmfme.mofpi.gov.in · PMKSY FAQs · mofpi.gov.in/PLISFPI · MoFPI 41-MFP list (31.01.2023)
Markets · three demand tiers

Demand the government can contract

Captive · surest

  • Fortified rice kernels — ₹17,082 cr program to 2028, 100% GoI-funded; ~3.5–4 LMT/yr standing demand
  • Fortified atta · Vitamin-E fortificant from own bran

Domestic growth

  • RBO — India #1 market, $1.39 bn; +exports $104.5 mn
  • Poha/murmura (snacks 14.5% CAGR) · besan
  • Maize starch $4.1 bn · wheat gluten

Export-led

  • Basmati ₹50,000 cr (FY25, +15.7%, ₹82/kg)
  • Plant protein (14% CAGR) · spices ₹39,994 cr · green silica (Tata ₹775 cr)
The offtake is contractable, not consumer-dependent: food-processing supply agreements + fortification mandates + institutional (PDS/ICDS) offtake form a demand backbone independent of the retail shelf — the ethanol-blending-mandate lever, applied to processed grain.
Sources: APEDA FY25 (basmati ₹50k cr) · DFPD FRK program · DGCI&S · industry market reports — verified/reported labelled
The prize · import substitution

₹21,000 cr/yr across the crops the state holds

StreamImport ₹/t (DGCI&S)Savings ₹ cr/yrOfftake
Rice bran oil97,9707,544 (gross import value displaced, not price×volume savings)frying/HoReCa + fortification
Pulses (dal margin)50,888–74,163~7,000dal millers + PDS
Cottonseed oil98,7661,975food processing
Maize starch37,1701,115food/pharma/paper
Husk → silica86,730867tyre/industrial
Protein · gluten · Vit-E · lecithin115k–17.7m~1,900processors + export
High-confidence tiers
₹18–21k cr
oil + pulses + industrial mid
On feedstock the state
already owns
via CMR procurement
Through offtake it can
contract
not hope for
Source: consolidated-savings-by-crop · DGCI&S FY26 import unit values · illustrative, additive
Import-Substitution Savings, by Stream ₹ crore/year, feedstock the state already owns Rice bran oil ₹7,544cr Pulses (dal margin) ~₹7,000cr Cottonseed oil ₹1,975cr Protein · gluten · Vit-E ~₹1,900cr Maize starch ₹1,115cr Husk → silica ₹867cr Source: consolidated-savings-by-crop, DGCI&S FY26 import unit values — illustrative, additive
Rice bran oil and pulses alone carry roughly ₹14,500 crore of the ₹21,000 crore/year prize.
A concrete MSV case · wheat → pasta

Durum wheat: the fastest-growing value-add India under-grows

The same "import the derivative, hold the feedstock" pattern — in wheat. India is wheat-surplus and sells it cheap via OMSS (~₹2,550/qtl), yet:

  • Pasta market $1.21 bn, growing ~14–16%/yr — the fastest wheat-product segment
  • India is the world's #2 durum-semolina importer — pasta needs durum (hard) wheat, which India barely grows (MP's Malwa belt, ~1.5–2 MT)
  • DGCI&S: pasta imports +24%, biscuit imports +28%, gluten +35% — the value-added tier's imports are building
  • Export prize: India ships only $63 mn of pasta into a global import trade of US $1.62 bn · Germany $1.24 bn — under 4% of the US market, on cheap OMSS wheat Italy can't match

The double play (durum MSV)

  • Procure durum by variety — a variety-specific MSV that de-risks durum cultivation (the wheat parallel to the oilseed-MSP production lever)
  • Mill semolina → pasta on OMSS/durum wheat, in a Mega Food Park
  • Substitutes both the pasta imports AND the durum-wheat imports
  • + vital gluten (13,000 t/yr imported) from the same wheat wet-mill
India is a net exporter of biscuits (Parle-G, 180 countries) — so the target is the premium/pasta/durum tier where imports are growing, not the mass market. Import substitution is already visible: durum-pasta imports fell −25% YoY.
Sources: DGCI&S TradeStat EIDB (exact 8-digit HS, FY25-26 prov.) · industry market sizes · report/wheat-value-added-products.md
A concrete case · edible oil from FCI/CMR stock reutilisation

The oil India imports for ₹1,68,000 cr — from grain the state already holds

India imports 168 LMT of edible oil — US$19.3 bn, ₹1,68,000 cr a year (57% of demand), landing at ~₹100/kg crude (palm ₹96). Yet the 24 MSP crops are the domestic oil-feedstock base — and FCI's own procured paddy throws off the cheapest oil in the country as a byproduct:

  • Rice bran oil — bran from the ~832 LMT of paddy under CMR; ₹60/kg ex-mill vs ₹105 import parity = ₹45/kg edge. India is the world's #1 RBO producer — and hands the bran to millers free (the ₹7,650 cr giveaway)
  • RBO is also the better oil: γ-oryzanol, tocotrienols, phytosterols; cholesterol-lowering; high-heat stable; non-GMO (ICRBO-2016)
  • Cottonseed oil — byproduct of cotton (an MSP crop): crush margin + cake

Import-substitution savings estimate

Stream₹/kg edge₹ cr/yr
Rice bran oil (7.7 LMT)457,544
Cottonseed oil (2 LMT)~101,975
Soy/sun crush — cake + forex*system~1,500
Capturable now~₹11,000 cr/yr

*at-parity oils save via the oil-cake co-product imports don't carry + forex retained, not a retail-price cut.

Honest tiering: ~₹11,000 cr/yr is capturable now from byproduct oils on feedstock the state already procures. The production lever (NMEO-OS oilseeds 39→69.7 MT) is the ceiling — closing even half the 168-LMT gap replaces ~₹84,000 cr of imports over 5–7 yrs — but mustard/groundnut are premium oils, a volume/self-sufficiency lever, never an in-year cheaper-cooking-oil promise.
Sources: DGCI&S TradeStat EIDB (168 LMT/₹1,68,000 cr) · DFPD edible-oil scenario · SEA (16.3 MT/₹1,61,000 cr) · consolidated-savings-by-crop · report/msp-crops-refined-oil-source.md
The proof it works · a mandate already saved ₹1,97,000 cr

Ethanol proves the model · OMSS the channel · rice-bran oil the un-pulled lever

1 · ETHANOL — the model
38 → 661 cr L; blending 20% by Nov-2025 (5 yrs early), on broken rice + maize. A blending mandate built the offtake.
₹1,97,000 cr forex saved
→
2 · OMSS — the channel
FCI already sells surplus grain to millers at reserve price: 71 LMT wheat + 1.6 LMT rice (2023-24). OMSS rice → millers → bran.
the RBO feedstock pathway
→
3 · RBO — the lever
India is #1 in rice-bran oil (NITI, Aug-2024), yet leaves the bran's oil in cattle feed. ₹60 vs ₹105/kg import parity = ₹45/kg edge.
the un-pulled lever
Govt CMR bran (~40 LMT)
₹6,698 cr
6.4 LMT RBO — import displaced, feedstock the state controls
All-India bran (~98 LMT)
₹16,464 cr
15.7 LMT RBO — the ceiling
Realistic near-term (+7.7 LMT)
₹7,544 cr
~5% of the ₹1,68,000-cr oil bill; +₹5,616 cr DORB feed
The ethanol mandate has saved ₹1,97,000 cr in forex since ESY2014-15 — built mostly on sugarcane, with surplus/broken grain a smaller but fast-growing share of the feedstock mix in recent years. The edible-oil bill (₹1,68,000 cr) is a same-size prize still largely untouched — and RBO is the grain-side lever not yet pulled: bran the state already owns and gives away free, with a PDS-oil / fortification mandate as the offtake, just as blending was for fuel.
Sources: PIB PRID 2113234 (ethanol) · PIB PRID 2200287 & NITI Aayog Aug-2024 (India #1 in RBO) · PIB PRID 2000937 (OMSS 2023-24) · rbo_savings_scenarios.py · report/omss-ethanol-rbo-import-substitution.md
Answering the objection · fuel vs food security

Byproduct oil isn't fuel-vs-food — it competes with imports, not the plate

The debate only exists when you burn the grain. It vanishes the moment you use the byproduct.

RouteFeedstockCompetes with food?
Grain → ethanolbroken/surplus grainpartially — the debate lives here
Bran → RBOmilling byproductNo — rice still feeds people
Cottonseed → oilcotton byproductNo
Husk → silica/energybyproductNo

Paddy is milled and the rice feeds people through PDS exactly as before — only the bran (today given to cattle with its oil intact) is processed. No grain leaves the food chain.

A clean decision rule

  • Byproducts first — bran/cottonseed/husk: zero food tradeoff, pure import substitution, unlimited go-ahead
  • Grain-to-fuel only above a stock threshold — institutionalise the July-2023 FCI-rice-to-ethanol pause (food already outranks fuel when stocks tighten)
  • Never compress the entitlement or divert issue-grade grain — the 80-cr guarantee is ring-fenced
  • Least water-intensive feedstock — maize/byproducts over paddy ethanol in stressed basins

Spoilage is negligible (0.002–0.022% of off-take) — the grain is fine; the question is its best use.

The real choice isn't food vs fuel — it's whether to capture the value of byproducts India already generates and gives away, or keep importing the derivative. RBO substitutes ₹1,68,000 cr of edible-oil imports, not the poor's ration.
Sources: PIB (ethanol/EBP; July-2023 FCI-rice pause) · DFPD Foodgrain Bulletin (off-take/spoilage) · report/fuel-vs-food-security.md
The live instrument · BPCL/OMC 40% FCI-rice ethanol clause (ESY 2025-26)

From 440 lakh ha of rice to a 52-LMT ethanol slice — is there "sufficient grain"? Yes.

Rice flow — where the grain goes (LMT · DA&FW / DFPD)
Production 1,378
cultivation · ~440 L ha
FCI proc. 520
38% of crop (rest = private/consumption/seed/export)
PDS/schemes 400
NFSA + PM-POSHAN + ICDS off-take
Eth. 52
ethanol segment — ~234 cr L (~3.8% of crop)
Carry-over (rice opening stock, 1 Jul) vs norm ~135 LMT
2021202220232024
297317253326
Stock runs 2–2.4× the buffer norm every year — a persistent ~150–190 LMT surplus. The 52-LMT ethanol draw sits comfortably inside it.
Holding 40% as NITI-roadmap volumes scale → FCI-rice need (LMT)
Now 1,050E20 1,350E27 1,650E30 2,000
52 ✅79 ✅105 ✅136 ⚠️
Sufficient to E27; at E30 the fixed 40% needs 72–91% of the surplus → shift growth to maize (NITI's own less-water steer).

The 40% clause — evaluated

New in ESY 2025-26: FCI surplus rice must be ≥40% of grain-based ethanol (A ≥ 40%×(A+B+C)). "Sufficient grain" is enforced by a 52-LMT cap, 30-Jun-26 sunset, and Q4 barred.

Verdict
✅ Converts idle surplus → guaranteed offtakegood
✅ Cap + sunset + Q4-bar = stock disciplineright instinct
⚠️ Fixed cap, not a live stock triggerblunt
⚠️ ₹2,320/qtl — ₹5.8/kg below OMSSsubsidy

Pair it with the byproduct route: the ethanol rice was milled from paddy — the bran→RBO is captured upstream regardless, so ethanol + RBO are complementary, not rival.

Storage is scaling with it: the World's Largest Grain Storage Plan adds +700 LMT cooperative capacity (₹1,00,000 cr → 2,150 LMT total) with PACS-level godowns + processing units — capacity to hold the surplus buffer and process it locally (bran→RBO, grain aggregation). Fix the clause: make "sufficient grain" a live stock-threshold trigger (not a fixed cap), price ethanol-rice at OMSS parity, mandate bran→RBO, and shift ethanol growth beyond E27 to maize.
Sources: BPCL/OMC ethanol tender ESY 2025-26 (T-22376) vs 2024-25 · DA&FW Final Est. 2023-24 (rice 1,378 LMT) · DFPD Foodgrain Bulletin (rice stock) · report/ethanol-fci-40pct-clause-evaluation.md
The safety valve · and why it's not free either

Maize substitution protects the rice buffer — but maize is already stretched

Cap FCI rice at the surplus-safe level (~79 LMT / E20), meet grain-ethanol growth from maize — NITI's less-water steer. But maize is not slack capacity:

Maize already =
42%
of ethanol (286 cr L, ESY23-24) — the primary grain feedstock
Maize→ethanol demand
75→126
LMT, ESY24→25 (+68%)
India in 2024 turned
net importer
of maize (+7,940%) — feed takes about 60% of the ~356 LMT crop
Maize-to-ethanol need if it absorbs grain-ethanol growth (rice capped 79 LMT)
NowE20E27E30
~90~140~219~311 LMT
vs ~356 LMT production & ~230 LMT feed demand → beyond E20 it needs maize output to rise sharply (yield 3.3 t/ha vs US 11) or deeper imports.

The honest read

  • It works to ~E20 — capping rice protects the food buffer, and maize is already the main feedstock
  • But maize isn't free — India is already a net importer; more maize-ethanol deepens imports + feed/poultry inflation
  • The real lever is maize yield/area — 3.3 t/ha vs US 11 t/ha is huge headroom (the ₹5.79/L maize incentive already signals it) — plus 2G ethanol
  • Not a swap that scales infinitely — beyond E27, neither rice nor maize alone sustains it; a stock-linked cap is unavoidable
The punch line: rice-ethanol and maize-ethanol both compete with food/feed. The byproduct route (bran→RBO) competes with neither — it uses the bran already generated, adding zero feedstock demand. That's why it's the first-best lever.
Sources: DA&FW (maize ~356 LMT 2023-24) · Drishti/DownToEarth (net importer; feed about 60%, DownToEarth alone gives 60–70%) · industry (maize→ethanol 75→126 LMT, 42% share) · NITI Ethanol Roadmap (maize/2G) · report/ethanol-fci-40pct-clause-evaluation.md
The escape from the food/feed constraint · 2G ethanol

2G runs on the straw, not the grain — the byproduct cascade, applied to fuel

Second-generation ethanol uses crop residue — rice straw (parali), bagasse, bamboo — agricultural waste, not food or feed. It resolves the whole debate at once:

Surplus crop residue
~140 MT
of ~500 MT/yr — much of it burned (NCR stubble smog)
Theoretical potential
~2,000 cr L
≈ 1.5× the E20 requirement — from waste alone
Food/feed competition
zero
no rice buffer, no maize imports, no feed inflation

PM JI-VAN plants (6 commercial + 4 demo)

  • Panipat (IOCL) — 100 KLPD, 3 cr L/yr from 2 lakh t rice straw, live Nov-2023 (₹984 cr)
  • Bargarh (BPCL) · Bathinda (HPCL) — 100 KLPD paddy-straw
  • Numaligarh (NRL) — 185 KLPD bamboo, live Sep-2025

Why it fits the thesis exactly

The same paddy, fully used — nothing wasted, nothing competes:

Grain
→ PDS food security + 1G ethanol (capped, stock-linked)
Bran
→ RBO (edible-oil import substitution)
Husk
→ silica / energy
Straw
→ 2G ethanol (+ ends stubble burning)

Honest caveat: 2G is capital- and tech-heavy — ₹984 cr for one 100-KLPD plant (~10× 1G capex/litre), enzyme costs high, biomass logistics hard. Output is still tiny today (~a few cr L of 661). It's the right long-run (5–10 yr) lever, not a near-term volume.

The resolution: cap grain-ethanol at a stock-linked level, and let 2G (straw) + the byproduct route (bran→RBO) carry the growth — both use residue the crop already produces, so blending can scale without ever competing with the plate or the feed trough.
Sources: PIB / PM JI-VAN Yojana (Panipat, Bargarh, Bathinda, Numaligarh 2G plants) · ChiniMandi (₹984 cr) · MNRE/IARI crop-residue (~500 MT / ~140 MT surplus) · report/ethanol-fci-40pct-clause-evaluation.md
Independent validation · the state's own auditor

The CAG audited the same inefficiency — and put ₹-figures on it

Every efficiency claim here is inferred from public data. The Comptroller & Auditor General (Report No. 20 of 2023, FY2017-22) found the same, audited — turning "a plausible reading" into "the supreme auditor agrees."

LTTC freight rebate forgone
₹1,736 cr
largest single avoidable cost — movement inefficiency (¶4.4.1)
Avoidable hiring — despite own vacant CAP
₹62.76 cr
+ ₹170 cr avoidable carry-over to SGAs (¶3.4.3 / 3.4.6)
Storage augmentation built
12.25 / 34.5 LMT
only ~36% of the 5-yr target (¶1.1.1)

Maps to the thesis

  • Over-hiring despite vacant capacity → size owned/coop to average, hire the peak
  • Sangrur silo — stock blocked (¶3.6.5) → the idle static base to divert to processing
  • Augmentation under-delivered → the cooperative/PACS storage plan
  • ₹158.88 cr railhead-issue foregone, Jharkhand (¶4.3.4) → distributed delivery

The honest counterweight

The CAG critiques execution, not the outcome. FCI still runs the world's largest food-security operation with negligible spoilage (0.002–0.022%). Both are true: the entitlement is delivered and the storage/movement machinery is materially inefficient — that slack is exactly what value-capture + cooperative storage convert, without touching the ration.

~₹2,383 cr of avoidable cost the CAG could quantify (2017-22) — the inefficiency isn't a reason to shrink FCI; it's the slack a processing + cooperative-storage redesign turns into value.
Source: CAG Report No. 20 of 2023 — Performance Audit on Storage & Movement of Food grains by FCI · report/cag-audit-fci-findings.md
The PDS · ONORC case · the demand rail already exists

₹2,00,000 cr already spent, 80 cr served — redirect the oil spend to domestic jobs

Domestic jobs

Fair Price Shops
5.43 lakh
99.8% ePoS-automated · dealer + staff livelihoods, every district
Rice mills
75k–100k
10–50 workers each · TN 3,399 · AP 1,913 · WB 1,873
Solvent-extraction plants
~350
875 SEA members · 30 MT processing capacity

Production volumes

MeasureLMT
Rice procured~520
Wheat procured300
Paddy milled/yr~850
Rice bran oil~10
Domestic edible oil122
Edible oil imported168
Oilseeds grown409.9
The milling that makes free PDS rice already throws off the bran for domestic oil.
Production Volumes in the Grain Value Loop Lakh metric tonnes (LMT) Paddy milled/yr ~850 Rice procured ~520 Oilseeds grown 409.9 Wheat procured 300 Edible oil imported 168 Domestic edible oil 122 Rice bran oil ~10 Source: post's consolidated production-volume figures, LMT
Domestic edible oil output is dwarfed by imports — and rice bran oil, the byproduct already on hand, is barely tapped.

State expenditure

Central food subsidy FY25
₹2,05,000 cr
free rice/wheat to ~80 cr (NFSA+PMGKAY) + ₹7,075 cr FPS margins
TN special-PDS oil+dal
₹3,800 cr
palmolein at ₹25/L on ~₹65/L subsidy — on an import (AP/KA/TG/WB run their own)
ONORC coverage
36/36
States/UTs · 20.54 cr cards · portable, deduplicated
The state already spends ₹2,00,000 cr+ and runs 5.43 lakh shops to feed 80 cr people — the demand rail is built. ONORC turns it into one portable, deduplicated national offtake: redirect the state oil subsidy from imported palmolein to domestic RBO, and the same rupee funds rice-mill, solvent-plant and oilseed-farm jobs instead of foreign crushers — import substitution and employment on infrastructure that already exists.
Sources: PRS Demand-for-Grants 2024-25 (Food & PD) · DFPD/PIB Year-End 2024 · TNCSC · DCMSME · SEA of India · data/pds_onorc_jobs_volumes_spend.csv
Per-state · who already subsidises oil & pulses in the ration

The oil subsidy is real, state-run, and spent on imports

StateOil in PDSPulse in PDSCard priceSpend ₹cr/yr
Tamil NaduPalmolein 1 L/cardTur dal 1 kgoil ₹25/L · dal ₹30/kg3,800
KarnatakaPalm oil + Indira kitTur/moong 1 kgdal ~₹38/kg~360*
GujaratEdible oil + sugarChana + tur dalsubsidisedn/p
Andhra Pradesh—Tur dal 500 gsubsidisedn/p
Maharashtra—Chana + urad₹35/kgn/p
Telangana—Red gram dalsubsidisedn/p
Kerala (Supplyco)Oil (below-mkt)Pulsesltd subsidyn/p
Centre (NAFED)—5.5 LMT → 11 statesvaries6,999†
TN palmolein bought
156 lakh L
+ 20,000 MT tur dal/yr — all imported oil
States running oil-PDS
4 major
TN · Karnataka · Gujarat · Kerala
States taking NAFED pulses
11+
pulses far more widespread than oil
Tamil Nadu is the flagship: ₹3,800 cr a year, almost entirely on imported palmolein — the single largest identifiable state oil subsidy a domestic-RBO switch would redirect. *Karnataka figure is dal-only (oil delivered in-kit); n/p = scheme confirmed on state portals but per-commodity spend not published — not zero. †NAFED chana, free to states, 2020.
Sources: TNCSC PDS scale · state civil-supplies portals · NAFED via Business Standard · press 2024-25 · data/pds_state_oil_pulse_expenditure.csv
The fiscal case · same rupee, with value capture

₹2,00,000 cr to give grain away — plus ₹2,00,000 cr to import what it could make

What the system costs now

Line item₹ cr
MSP paid to ~1.3 cr farmers2,32,000
Food subsidy (free grain, 80 cr)2,05,000
Edible-oil imports1,68,000
Pulse imports31,000
Excess-stock carry (~330 LMT over buffer)18,000
Rice bran given away free7,650

No double-count: procurement sits inside the subsidy. The two clean burdens are the ₹2,05,000 cr subsidy + ~₹2,00,000 cr imports.

What the Grain System Costs Now ₹ crore/year MSP paid (~1.3cr farmers) 2,32,000 Food subsidy (free grain) 2,05,000 Edible-oil imports 1,68,000 Pulse imports 31,000 Excess-stock carry 18,000 Rice bran given away free 7,650 Source: post's consolidated fiscal-cost figures; procurement sits inside the food subsidy, not added separately
The two clean burdens — the free-grain subsidy and edible-oil imports — are each roughly ₹2 lakh crore a year.

What processing recovers

Line item₹ cr
Import substitution (processing)21,087
— of which capturable now~11,000
Byproduct monetised (bran → RBO)7,650
Excess-stock carry avoidedup to 18,000
Processing-margin uplift3–5×

No double-count: bran→RBO is already inside the ₹21,087 cr total above (it's section 9's rice-bran-oil row), shown again here only as the flip side of the giveaway cost in the card opposite — not an additional sum. Branded staple processing earns 11–12% EBITDA vs 2–4% raw trading — the money is in the processing, not the sourcing.

Nothing in the food-security guarantee is cut. Farmers still get MSP; 80 cr still get free grain. What changes: the byproducts stop being given away and the oil/pulses stop being imported — the surplus and the byproduct are processed instead of dumped and re-imported. A value-capture layer bolted onto a ₹4,00,000-cr/yr machine, not a new subsidy.
Sources: PIB/FCI procurement (wheat ₹62,156 cr RMS25-26) · PRS food subsidy ₹2,05,000 cr · DGCI&S imports · FCI stock 738 LMT (1 May 25) · report/fiscal-rationalisation-procurement-vs-processing.md
National build-out · storage × farmer-aggregation

The grain and the farmers are in different states — design for it

StateFCI storage LMTSFAC FPOs
Madhya Pradesh200348
Punjab17578
Haryana100119
Uttar Pradesh47758
Bihar21312
Andhra Pradesh25247
Rajasthan16225
Maharashtra24213

FCI+hired storage (Nov-24 bulletin, ~841 LMT all-India) · SFAC 10,000-FPO registry (3,649, Feb-25 — SFAC channel only)

The mismatch = the design rule

  • Storage belt (Punjab 175, MP 200, Haryana 100) holds the grain — but is thin on FPOs (Punjab 78)
  • FPO belt (UP 758, Bihar 312, AP 247, Rajasthan 225) has the farmers — but far less storage
  • MP is the one state with both — 200 LMT + 348 FPOs + soybean/pulses/mustard = the natural first hub

Siting logic: oilseed/pulse crush → FPO-dense deficit states (MP, Maharashtra, Rajasthan, AP); rice-bran → the paddy/storage belt (Punjab, Haryana, Chhattisgarh). Match each stream to the state that has its feedstock and the aggregation.

Sources: DFPD Foodgrain Bulletin Nov-2024 (storage) · SFAC state-wise 10,000-FPO list 24-02-2025 · data/national_fci_fpo_by_state.csv
The vehicle · don't create a PSU — revive the one DFPD owns

DFPD already owns a dormant edible-oils processing PSU

Per igod.gov.in, DFPD's org chart already holds three delivery bodies:

FCI
procurement · storage · the grain + bran feedstock
CWC
the warehousing network
HVOC — Hindustan Vegetable Oils Corp
a CPSE built for vegetable-oil / vanaspati processing — now dormant

India needn't create a food-processing PSU — it can revive HVOC: the corporate shell, the DFPD mandate and the edible-oil remit already exist, alongside the grain (FCI) and the storage (CWC).

Build it like the survivors, not the failures

  • Infrastructure + processing, NOT trading — STC→PEC→NCEL died trading naked
  • FPO-fed supply — the AMUL/NAFED survival trait
  • Ring-fenced, contracted offtake — PDS/ONORC oil + fortification, not the open market
  • JV/PPP capital — HVOC brings mandate + sites; partner brings crush/refining
  • Sit on the FCI/CWC network + the ₹7,650 cr free bran
A revived HVOC is the edible-oil counterpart to FCI: FCI holds the grain, HVOC processes the oil, CWC stores, FPOs supply, ONORC distributes — anchoring the ₹1,68,000-cr import substitution and supplying the PDS oil ration domestically instead of buying imported palmolein.
Sources: igod.gov.in DFPD org list (FCI/CWC/HVOC) · report/psu-agri-ventures-history.md (STC/PEC/NCEL vs CWC/AMUL) · report/national-fci-fpo-food-processing-psu.md
The model · why government-cooperative-PPP

Ring-fence the commercial arm; contract the offtake

Structure

  • PACS/FPO aggregates paddy + bran (already the procurement centre)
  • Private partner builds + runs RBO extraction, silica, power (the capital + know-how)
  • State provides VGF/PMKSY grant + a fortified-rice / RBO offtake guarantee
  • Ring-fenced from MSP/buffer policy — the COFCO lesson, not the STC/Thailand failure

Why not leave it to private millers

  • 100,000 mills do basic CMR — but won't invest in bran stabilisation, RBO, silica, cogen
  • The integrated value-added mill is the PPP white space (verified: largely untried)
  • The offtake guarantee is the revenue backbone — mirrors PEG's silo-hire guarantee
History's warning (verified): STC→PEC→NCEL failed by trading naked; CWC, AMUL, Kendriya Bhandar succeeded by infrastructure / farmer-ownership / ring-fencing. This is an infrastructure + processing play, not a trading arm.
Sources: PPP rice-mills · PSU-agri-ventures-history · agri-trader-playbook
Illustrative pilot

One integrated complex, in an operational food park

Anchor: rice mill
₹80 L
1 TPH, 19% IRR (NCDC DPR)
+ RBO extraction
₹15–40 cr
8–15% margin, the ₹7,544 cr anchor
+ poha/murmura line
₹21 L
10–15% margin, <3y payback
+ husk power/silica
cluster
energy self-sufficiency + tyre-grade silica
Capital subsidy
35–50%
PMKSY cluster + PMFME units
Offtake secured by
contract
FRK/PDS + food processors + fortification
The proof-points already exist as verified DPRs and operational parks. The novelty is integration + the offtake guarantee — assembling proven units into one government-anchored complex that captures the cascade instead of gifting it.
All component economics from real project DPRs; integration is the un-built step
Why it matters · Doubling Farmers' Income

Real farm income is ~a third of the way to doubling

The 2016 goal: double farmers' real income by 2022-23. Deflated by CPI-AL (the farm household's own cost basket, MoSPI), the Real Farm Income Index reads:

2016-17
RFII 99
→
2021-22
RFII 131
→
Target
200 = doubling

Achieved ~5.7%/yr real vs the 10.4%/yr needed — reaching 200 slips to ~2030.

The lever the gap needs

  • Crop income is only 37% of farm income — price alone can't double it
  • The other 63%: wages, livestock, non-farm/value-addition
  • Cutting cost defends real income against inflation the nominal headline hides
  • Exactly the byproduct-cascade + processing-margin this project builds
RFII is a monitorable metric: CPI-AL deflator refreshes monthly (MoSPI), income on each SAS/NAFIS survey.
Sources: NABARD NAFIS 2021-22 · NSSO SAS · MoSPI CPIALRL · Dalwai Committee (DFI)
The farm-side loop · fuel choice

Diesel→CNG + residue: the inflation-proof income lever

Fuel shift (diesel→CNG)
+₹5,400
/yr per 1.5-ha paddy household · 24% on tractor fuel · +3.3 RFII pts
Full CBG loop (+residue)
+₹9,750
/yr · residue→CBG + FOM slurry · +5.9 RFII pts · closes 9% of the doubling gap
Mill fuel choice
₹1 vs ₹10.45
husk/CBG per kWh vs grid · ₹2.7-7.9 cr/yr on the mill's EBITDA
The loop closes: crop → residue → CBG → fuels the tractor (24% cheaper, inflation-proof) AND the mill's boiler → slurry to the field. Diesel is a volatile imported input; CBG from the farmer's own residue defends the real income the doubling metric measures.
CACP A2+FL · PIB CNG-tractor (PRID 1697555) · SATAT CBG · TN diesel/CNG Jul 2026
The one-line case

Stop gifting the byproduct.
Contract the demand. Capture the cascade.

India is the world's #1 producer of the raw byproduct and a net importer of the refined derivative — for oil, gluten, starch, protein, and Vitamin-E alike. The feedstock is procured, the subsidy is 35–50%, the parks are built, the DPRs are proven. What's missing is the integrated complex and the offtake guarantee. That is the project.

Savings
₹21k cr/yr
Best DPR margin
poha 10–15%
Best DPR IRR
dal 25–31%
Full analysis, data & sources: github.com/herrrickshaw/FCI-warehouse-MSPvsMSV · research synthesis, not investment advice
Related on this blog: FCI Storage Scenario — Capacity, Stock, and the Road to 2,150 LMT · The Price of Grain: MSP, MSV, and the Arithmetic of the Indian Grain State · Jai Kisan, Jai Javan — An FCI-Based Military Ration Strategy — the FCI storage and MSP/MSV pieces this biorefinery pitch is built against, and an alternative surplus-diversion proposal (military rations).

What would fix this

  • The Department of Food and Public Distribution should publish each year the tonnage of bran and husk generated from custom-milled government paddy and what millers are charged for it, so that the ₹7,650 crore byproduct transfer becomes an official figure rather than an estimate.
  • FCI should publish annually the carrying cost of rice and wheat stocks held above buffer norms, so that the roughly ₹18,000 crore cost of excess stock, and the 2–2.4 times buffer-norm rice carry-over, are reported by the holder of the stock.
  • The civil supplies departments of Karnataka, Gujarat, Andhra Pradesh, Maharashtra, Telangana and Kerala should publish per-commodity spending on edible oil and pulses in their PDS, so that the state oil subsidy can be sized beyond Tamil Nadu’s ₹3,800 crore.
  • The Department of Agriculture & Farmers Welfare should publish a single state-wise registry of FPOs formed under all implementing agencies, not SFAC alone, so that siting decisions that match feedstock to farmer aggregation rest on complete counts.

These are proposals from this blog, not recommendations any agency has adopted.

About this article: Researched, written and edited by Umashankar Triplicane Dwarakanathan, with AI research assistance; every figure is meant to trace to the primary source cited. See the Editorial Policy for how sourcing, AI use and corrections work.

Umashankar Triplicane Dwarakanathan
Contact Us
Umashankar Triplicane Dwarakanathan
Investment Promotion & Energy-Sector Leader · Chennai, Tamil Nadu, India
LinkedIn → GitHub → Email +91 78273 81696
How this site works

Data-led analysis of India's trade, currency and industrial policy. Every article is built from primary official sources, and every figure links back to the release, table or filing it came from.

Sources. DGCI&S TradeStat (imports/exports, HSN-wise) · PIB (government press releases, January 2017 to today, refreshed daily) · RBI (circulars, balance of payments) · MoSPI (CPI/WPI, IIP) · PARIVESH (environmental clearances) · CCIL (bond yields) · BIS (policy rates) · SEBI, NSE/BSE and SEC filings for company data.

Interpretation. Figures carry their vintage and retrieval date; estimates and press-reported numbers are labelled as such; where sources disagree, both are shown. Corrections are made visibly, never silently. Articles are written with AI assistance from the cited sources — AI-generated text can misstate figures even when working from real material, so verify any number that matters to a decision against the linked primary source.

footer

Browse all articles by topic

Every piece on this blog, grouped. Or read the full index.

Agriculture & FertilisersAI ToolsChemicalsClimate & CarbonEnergy & FuelsGas & LNGImport SubstitutionIndustrial PolicyMarkets & FinanceMobility & EVPrices & InflationTextilesTrade & Tariffs

Each topic is a live archive page that updates itself as pieces are labelled. It replaces a hand-kept list that had fallen 18 articles behind.